2025 Market Volatility Update – Understanding the Current Market Selloff
Chart of the Month | March 2025
Recap of Year-to-Date Market Performance
Stocks started 2025 trading higher but have since pulled back. The S&P 500 has declined more than -8% from its all-time high on February 19th, lowering its year-to-date return to -5% (Figure 1). The Nasdaq 100, an index of technology and growth stocks, is down -7% year-to-date, while the small-cap-focused Russell 2000 has fallen -9%. The Magnificent 7, a group that includes Microsoft, Apple, Meta, Alphabet, Amazon, Nvidia, and Tesla, has declined nearly -15%. Given the recent volatility, our team wanted to discuss the current environment and provide a market update.
What’s Behind the Market Selloff?
Several factors are contributing to the current market selloff. First, momentum stocks that led the 2024 rally are now experiencing a sharp reversal. Figure 2 shows 2024’s top performers have become 2025’s underperformers. Technology stocks, the Magnificent 7, and Large Cap Growth powered last year’s gains, fueled by enthusiasm for the artificial intelligence industry. However, the concentrated rally led to stretched valuations and crowded positioning, particularly among the biggest companies. As those stocks lose momentum, it’s triggering a rapid unwind, with a large amount of capital rotating at once. Second, investor exposure to the stock market was high entering 2025. Households’ allocation to stocks reached a record high, and institutional investors, such as pension funds, endowments, and insurance companies, increased their leverage and equity exposure last year as stocks traded higher. Now, institutional investors and hedge funds are deleveraging, adding to the selling pressure. Third, optimism around the Trump administration’s pro-growth policies has given way to concern, with worries that spending cuts and the uncertainty created by tariffs will slow economic growth.
Market Volatility vs. Economic Reality
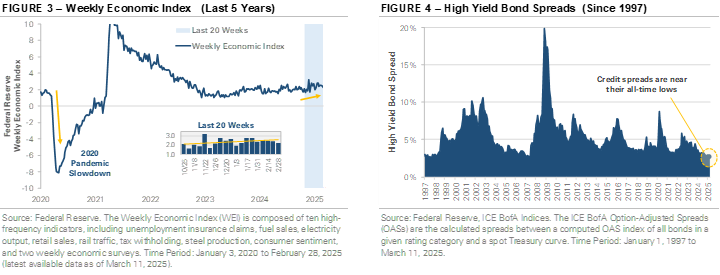
It’s important to remember that the stock market isn’t the economy, with some data points signaling a different economic reality. The Federal Reserve’s Weekly Economic Index (WEI), which tracks real-time activity using data such as unemployment claims, rail traffic, steel production, and tax withholdings, remains positive (Figure 3). Despite recent stock market volatility, the WEI suggests the broader economy hasn’t felt a significant impact. In the bond market, high-yield credit spreads, which measure the difference in yield between riskier corporate bonds and U.S. Treasuries, remain near all-time lows (Figure 4). The stability of credit spreads indicates that, so far, the selloff has been largely confined to the stock market. Together, these two data points suggest the recent volatility may be a market-specific adjustment rather than a systemic issue or sign of broader financial strain.
Is This Normal and Can the Market Selloff Continue?
Market volatility can be unsettling, but it’s a normal part of investing. Periods of enthusiasm often lead to recalibration. It’s natural to feel uncertain, but history shows that staying invested through volatility and maintaining a longer-term view is a prudent approach. Since 1928, the S&P 500 has experienced a decline of -5% or more in 91 of the past 98 years. Yet, markets have demonstrated an ability to recover and rewarded patience. By maintaining a diversified portfolio aligned with your long-term goals, we’re positioned to weather the market’s swings.


Important Disclosures
Figure 2 Additional Disclosures – The performance information shown herein is based on price returns and does not reflect the deduction of advisory and/or other fees normally incurred in the management of a portfolio. Stock performance data is based on the following instruments: iShares S&P 500 Growth ETF (IVW), Invesco S&P 500 Top 50 ETF (XLG), Financial Select Sector SPDR Fund (XLF), Invesco QQQ Trust Series I (QQQ), SPDR S&P 500 ETF Trust (SPY), Technology Select Sector SPDR Fund (XLK), Invesco S&P 500 Equal Weight ETF (RSP), iShares Russell 2000 ETF (IWM), iShares S&P 500 Value ETF (IVE), Consumer Staples Select Sector SPDR Fund (XLP), Health Care Select Sector SPDR Fund (XLV).
The information and opinions provided herein are provided as general market commentary only and are subject to change at any time without notice. This commentary may contain forward-looking statements that are subject to various risks and uncertainties. None of the events or outcomes mentioned here may come to pass, and actual results may differ materially from those expressed or implied in these statements. No mention of a particular security, index, or other instrument in this report constitutes a recommendation to buy, sell, or hold that or any other security, nor does it constitute an opinion on the suitability of any security or index. The report is strictly an informational publication and has been prepared without regard to the particular investments and circumstances of the recipient.
Past performance does not guarantee or indicate future results. Any index performance mentioned is for illustrative purposes only and does not reflect any management fees, transaction costs, or expenses. Indexes are unmanaged, and one cannot invest directly in an index. Index performance does not represent the actual performance that would be achieved by investing in a fund.